
NBA Betting Models: Using Statistics to Find an Edge
 Available in US
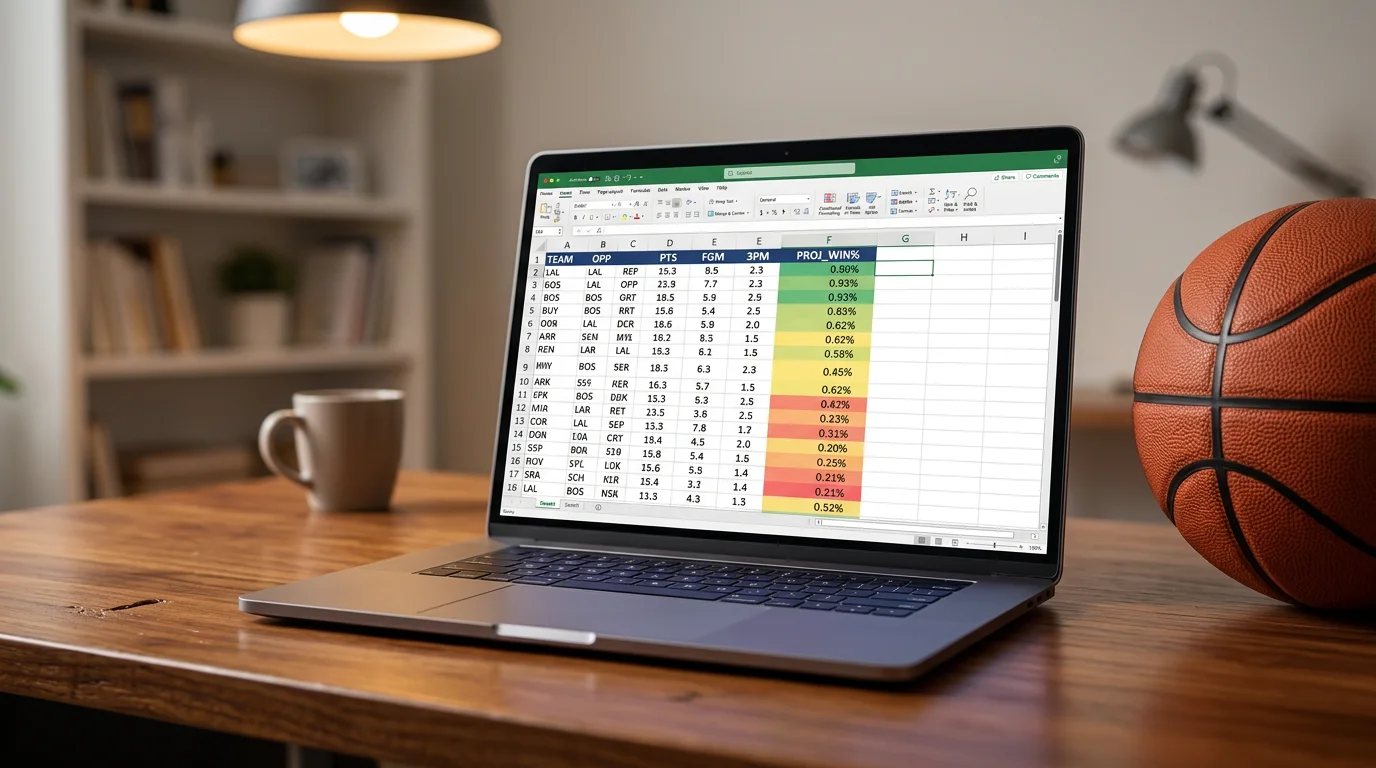
My first betting model was a spreadsheet with five columns. Team name, net rating, opponent net rating, home/away flag, and the predicted margin. It took an afternoon to build, used freely available data, and outperformed my gut instinct from the very first week. The model wasn’t sophisticated — it was barely a model at all by serious standards — but it imposed structure on a process that had been entirely intuitive. That structure was worth more than any single statistical insight because it forced consistency. Every game went through the same filter, and the bets that emerged were based on numbers rather than narratives.
Explore nba betting online for data-driven NBA insights.
Essential NBA Statistics for Betting Models
Net rating is the foundation. It measures the difference between a team’s offensive rating (points scored per 100 possessions) and defensive rating (points allowed per 100 possessions). A team with a net rating of +5.0 outscores opponents by 5 points per 100 possessions, which translates to roughly a 5-point advantage in a standard-pace game. Net rating is the single best predictor of team strength because it controls for pace — unlike raw scoring average, which conflates quality with speed of play.
Pace matters independently because it determines the number of possessions — and therefore the number of scoring opportunities — in a given game. Two teams with identical offensive and defensive ratings will produce a different total if one plays at 98 possessions per game and the other at 106. My model uses pace explicitly in the totals calculation: (Team A offensive rating + Team B offensive rating — league average) x (Team A pace + Team B pace) / (2 x 100). That formula gives a raw expected total that I then adjust for specific matchup factors.
Effective field goal percentage (eFG%) captures shooting efficiency including the extra value of three-pointers. A team shooting 52% eFG% is significantly more efficient than one at 48%, and that gap predicts game outcomes better than raw field goal percentage. Turnover rate, offensive rebounding percentage, and free-throw rate complete the “four factors” framework that Dean Oliver developed and that remains the analytical backbone of serious NBA modelling. Whichever of these four areas a team wins most consistently, they tend to win the game.
Building a Simple Predictive Model
You don’t need machine learning or programming expertise. A spreadsheet with publicly available data produces a useful model. Here’s the structure I started with and still use as my baseline:
Column A: team net rating (last 20 games, not full season — recent form is more predictive). Column B: opponent net rating (same window). Column C: home-court adjustment (+3 for home team, -3 for away). Column D: predicted margin, calculated as (Team A net rating — Team B net rating + home adjustment) / 2. The division by 2 converts the per-100-possessions metric to a per-game margin at average pace. Column E: the bookmaker’s spread. Column F: the discrepancy between my predicted margin and the market’s line.
When Column F shows a discrepancy of 2 or more points, the game warrants deeper analysis. Not every discrepancy translates to a bet — injuries, schedule spots, and matchup-specific factors explain many of them — but the model flags which games deserve your research time. That prioritisation alone improves your results because it prevents you from wasting analysis on games where the market is already efficient.
Professional NBA handicappers hit 47-49% on spreads and totals. A simple model won’t outperform the sharpest minds in the market, but it will outperform your unstructured intuition. The gap between 50% (coin flip) and 53% (sustainable profit) is tiny, and a model that eliminates impulsive bets and focuses your attention on mispriced games gets you meaningfully closer to that threshold.
Advanced Metrics Worth Tracking
Once the basic model is running, these metrics add resolution without adding complexity. Opponent-adjusted ratings recalibrate a team’s net rating based on the quality of opponents faced. A +3.0 net rating against a top-10 difficulty schedule is more impressive than +3.0 against a bottom-10 schedule, and the adjustment reveals which teams’ ratings are inflated or deflated by schedule strength.
Clutch metrics — performance in games within 5 points in the final five minutes — are noisy over small samples but predictive over 30+ games. Teams that consistently perform well in clutch situations tend to cover fourth-quarter spreads more often, which connects directly to quarter and half-time betting opportunities. Wang et al. found that 19% of NBA games are within 10 points entering the fourth quarter, so the clutch performance data applies to roughly one in five games.
Rest-adjusted efficiency separates performance on standard rest from performance on back-to-backs or extended rest. Most public models use season-long averages, which blend rested and fatigued performances into a single number. Splitting the data reveals teams whose true quality fluctuates by 2-3 points based on rest status — and those fluctuations are often wider than the market’s schedule adjustment.
Apply your models to factor in NBA home court advantage trends.
What Models Miss and Why Human Judgment Still Matters
Models quantify the quantifiable. They don’t capture coaching adjustments, locker room chemistry, a player returning from injury at 80% fitness, or the motivational effect of a rivalry game. These qualitative factors explain a meaningful portion of the variance between my model’s prediction and the actual result, which is why I treat the model as a first pass rather than a final answer.
My workflow: the model flags 5-8 games per night where the discrepancy exceeds my threshold. I then research each flagged game manually — checking injury reports, reviewing recent film notes from beat reporters, and assessing the schedule context. That manual layer adds roughly 30 minutes of work per night but filters out 3-4 games where the discrepancy has a clear explanation. The 2-3 games that survive both the quantitative and qualitative filters are my betting candidates. If that systematic approach appeals to you, the value betting guide covers how to convert model outputs into actual expected-value calculations that determine your stake.
What is the best statistic for predicting NBA game outcomes?
Net rating — the difference between points scored and points allowed per 100 possessions — is the single most predictive team-level statistic. It controls for pace, captures both offensive and defensive quality, and correlates strongly with win percentage over full-season samples. Most serious NBA betting models use net rating as their foundation.
Do I need programming skills to build an NBA betting model?
No. A basic spreadsheet using freely available team statistics is sufficient for a useful model. You need net ratings, pace data, and a home-court adjustment. The model flags games where your predicted margin diverges from the bookmaker’s line, directing your research toward the most likely mispriced games.
Written by the editors at nba Betting Online.